01Setup
On first launch, a six-step onboarding sequence introduces the console, then configures it:
- Tempest Station Telemetry — the app listens on your local network for your station's UDP broadcast automatically; if you want cloud history and backfill too, add a WeatherFlow personal access token, which is verified in-app before you continue.
- Station Location — a label only: a name shown on the dashboard next to your station ID, set by GPS or typed in manually. It doesn't drive any weather logic by itself.
- Units & Display — temperature, wind speed, rain rate, pressure, and lightning distance units, plus display options.
- Data History & Privacy — a short note confirming observations are stored locally on the iPad; nothing changes on Tempest's or WeatherFlow's side.
- Completion summary — a recap of what was configured. This step also requires checking a life-safety acknowledgment (Atmos Console is an informational dashboard, not a certified weather-warning service — for official watches and warnings, consult the National Weather Service) before the Continue button unlocks and the dashboard opens.
02The Dashboard
The dashboard is a single fixed screen — nothing scrolls, so it's safe to leave running on a 24/7 wall display. Atmos Console is built for iPad only.
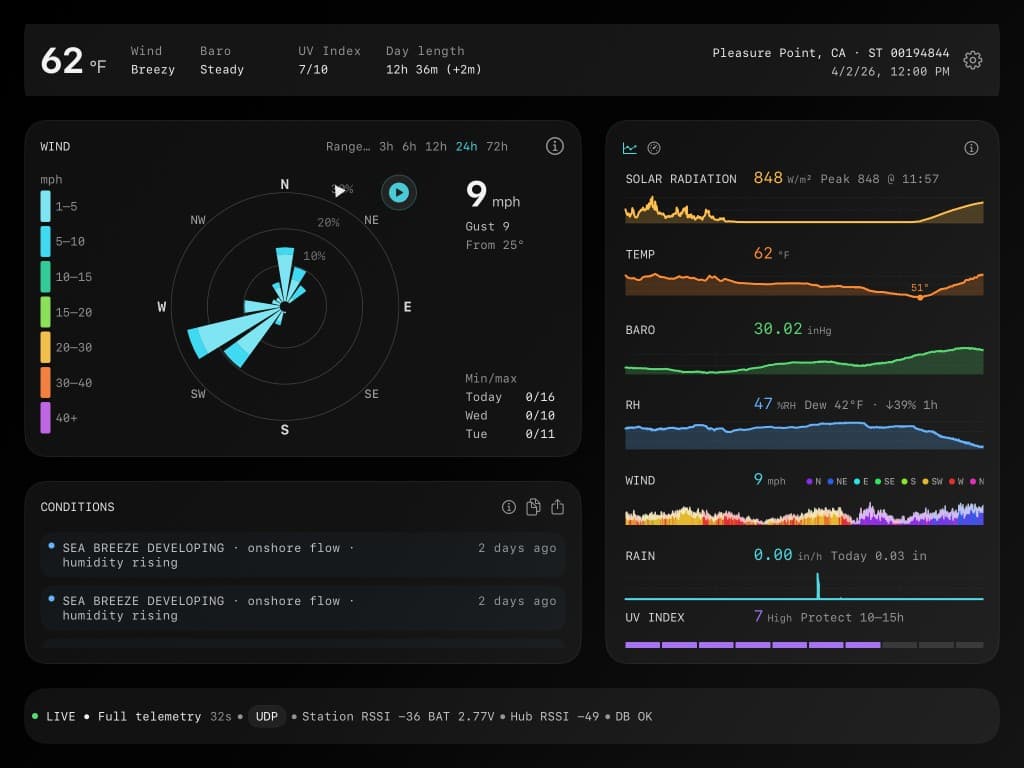
Summary bar
One top bar: current temperature, wind/pressure/UV status, station location and ID, the range selector, clock, and the CONFIG button.
Range selector
Sits inline in the summary bar. Choose the window every chart reads from: 3h, 6h, 12h, 24h, 72h, or a custom Range…
Wind card + Conditions
Left column: compass rose and window summary above, the Conditions panel below.
Telemetry panel
Right column: scrolling strip charts — solar, temperature, pressure, humidity, wind, rain.
Along the bottom, the event strip carries connection status, station/hub signal, storage size, and a feedback link — see Connection Status.
03Wind Card
The compass rose shows live wind direction and speed by sector — wedge color follows the speed-band legend beside it. Below that, a window summary reads over the selected range: Prevailing direction and its share, Mean speed, Peak Gust with the time it occurred, Calm %, and Steadiness, plus a standing 7-Day High line that always covers the trailing seven calendar days regardless of the range selector. Tap Detail to open the fuller wind view, with scrubbing and playback.
04Telemetry Strips
Six scrolling strips share the chosen time range: solar, temperature (with dew point), pressure, humidity, wind, and rain. A few things worth knowing:
- The temperature strip annotates the day's low and high; nearby overnight lows are merged into a single pair of annotations so labels don't collide.
- Gaps in coverage over five minutes are shown as a dashed, low-opacity band — this is diagnostic, not an error. Gaps bridged by history backfill are not marked, since that data has been repaired.
- Turn on Sync Cursor (Configuration → Display) to scrub one strip and see a matching cursor and unified readout across all of them.
- The wind strip is a meteogram (sustained-speed trace) with a gust overlay you can choose in Configuration → Display: Dual Line (solid sustained line, dashed gust line — default) or Gust Band (filled gust envelope).
- Tap Detail on the Telemetry panel to open a full-screen view where you can choose which strips are visible.
05Conditions
This panel lists what's currently happening and any recognized weather pattern, each as one line — a colored dot, then title and detail, with how long ago it started or ended on the right.
| Label | What it means |
|---|---|
| ● Cyan | Background — worth noting, no action implied. |
| ● Amber | Notable — a building or confirmed condition. |
| ● Orange | Strong signal — e.g. lightning within 5 km. |
Text is templated from your station's own readings — the app does not generate free-text narration. Tap a lightning row for a detail view with strike counts, distance, and timeline. If regional phenomena are enabled and your coastal bearing is set, sea-breeze and land-breeze rows can appear here too.
06Connection Status
The bottom event strip reflects how your station is being heard. Atmos Console prefers your station's local UDP broadcast and falls back to the WeatherFlow cloud API when needed.
| Label | What it means |
|---|---|
| ON CONSOLE | Live or degraded — recent data is arriving. The telemetry-mode text next to the source tag distinguishes full telemetry from wind-only (rapid-wind packets arriving, full observation stale); an amber tint marks degraded. |
| ACQUIRING / STARTING | Just (re)connecting — normal during app launch or a brief drop. |
| STALE | No fresh packet in several minutes. |
| OFFLINE | No usable data from either source. |
| ERROR | An acquisition failure, not just aging data. |
Tap the source/telemetry text (e.g. "UDP TELEMETRY NOMINAL") in the event strip for a popover explaining the active source and its update cadence. Station and hub signal strength (dBm) and battery voltage appear as separate fields in the event strip when available, not in the popover.
07Configuration
Tap CONFIG in the summary bar to open it. Configuration is organized by section:
- Units — temperature, wind, rain, pressure, and lightning distance.
- Connection — your WeatherFlow token, station, and location.
- Display — Keep Screen Awake, burn-in protection, sync cursor, wind strip gust (Dual Line or Gust Band), and clock format (12/24-hour, local/UTC).
- Detection — the Regional Phenomena toggle and coastal bearing (sea breeze / land breeze) configuration.
- Notifications — alert notifications on/off.
- Data — history retention, CSV export, and a clearly-marked reset for local history.
- Demo, Feedback, Diagnostics — a lightning simulation for trying that panel without waiting for a real strike, a feedback/report sheet, and raw diagnostics detail.
08Data & History
Observation history is stored locally on-device, independent of retention on WeatherFlow's own cloud service.
- Retention: 90 days, 1 year (default), 2 years, or indefinitely.
- Export: save your history to CSV for analysis elsewhere.
- Reset: a destructive action with a confirmation step. It only clears the local copy — your data on WeatherFlow's servers is untouched.
- Backfill: if local history is empty and your API token is connected, the app will offer a one-time import of available cloud history so charts and wind history aren't starting from zero.
09Tips
- Leaving the console running 24/7 is expected — that's what the layout and burn-in protection are built for.
- If a reading looks frozen, check the event strip first: wind-only telemetry and STALE both explain a stalled non-wind value without anything being wrong with the station.
- Weak signal is usually an RSSI or distance issue between the station and your hub, not an app problem — the source popover in the event strip shows current signal strength.